The bespectacled crocodile
by John Hall
An illustrated manual for facilitating Holistic Management in pastoral communities.
TABLE of CONTENTS: Monitoring and replanning
36. Participatory monitoring: choice of indicators
37. Participatory monitoring: collection and analysis of results
38. Replanning
| The bespectacled crocodileby John HallAn illustrated manual for facilitating Holistic Management in pastoral communities. |
Some rights reserved. You may copy and distribute this manual or parts of it if you (1) credit the original authors, (2) include this notice, including the copyright license information below, and (3) on partial copies, include the following link where people may download the complete manual. English and French versions are available at
http://managingwholes.com/crocodile/
You may create and distribute derivative works, adaptations, and translations under the same conditions. If possible, please make an electronic copy available for public distribution (you can do this through ManagingWholes.com), and send the URL to the author:
If you wish to use this manual for commercial purposes, please contact the author.
Creative Commons license:
http://creativecommons.org/licenses/by-nc-sa/1.0/
![]()
INSTRUCTIONAL UNIT NINEMONITORING AND
|
|
|
Introduction to the « observation » game
Ask participants to choose a partner and to sit down facing that person. Ask them to look carefully at their partner, noticing the clothes he is wearing, their color, accessories, etc. Then, ask them to turn away from each other and to change just one detail in their appearance. Just a single detail. Show, without speaking, how this can be done : remove your hat, roll up your sleeves, move a ring from one finger to another, etc.
After two minutes, ask participants to come back and look at their partners carefully once more. They will now have to guess how this partner changed his appearance. After two minutes (for the game must be played quickly), stop the game and ask the following questions :
· What happened ?
· Was the change difficult to see ? Why ?
· What lessons can one learn from this game ? (Answer: One must observe things attentively in order to perceive and remember them.)
Explain that this is exactly what they will strive to do during the next two modules, stressing how frequently one fails to observe properly and how important it is to do so.
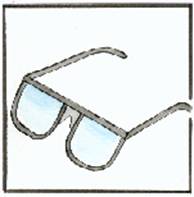
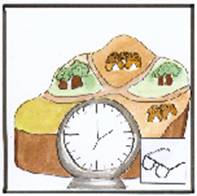
At this point, display a pair of eyeglasses. Why do people wear glasses ? (Answer: in order to see clearly). This is why we have chosen eyeglasses as the icon for this instructional unit. They will study together how to better observe the things around them, so that they can better manage them.
MODULE # 36:MONITORING AND
|
|
|
PEDAGOGIC ANALYSIS
Desired situation
The entire community identifies the landscape, production and quality of life indicators, gathers them together and analyses them.
Current situation
At the family level, people are of course aware of changes in landscape, income and living conditions, but this information is not pooled with that of other community members and is not consolidated at the community level with a view to correcting any deficiencies that might exist.
Disparity between current and desired situation
¨ When reflection occurs at the family level, it is very difficult to conceive of criteria/indicators covering all the elements of the desired objectives, on both an individual basis and a community basis;
¨ Results of this reflection are not consolidated with those of the rest of the community.
Objectives of the module
By the end of the training session, the participants will be able to identify their own measurable indicators pertaining to their goals in terms of landscape, production and quality of life.
LOGISTICS
Target group :
The entire community, with all its constituencies represented, should be involved with this module:
· men and women;
· young people and the elderly;
· herders and farmers, etc.
Exercises utilized by the module :
· "Observation game"
· Unserialized posters (Srinavasan, p.89)
· Brainstorming
|
|
|
|
|
|
Before getting into participatory monitoring, participants are invited to imagine how such monitoring fits in with the development of the management plan. (39/01) |
|
Graphic supports :
Folder #36
Approximate duration of the module :
2 hours
IMPLEMENTATION
1. Reiterating the three-part goal
Place the three icons representing the three-part goal ( ("landscape" (# 7), "production" (# 6) and "quality of life" (#5)) down on the mat and ask participants to recall what they mean. Then ask them to spend a few minutes discussing the three parts of their holistic goal. Insist that they provide details. This is very important, since they must subsequently choose their indicators on the basis of these details.
· How did they describe the « landscape » part?
· How did they describe the « production » part?
· How did they describe the « quality of life » part ?
· How did they base their management plan on the elements of the goal ?
2. Process of monitoring/re-planning
Next, place three other images down on the mat :
¨ the generic icon for "participatory monitoring" (i.e., the eyeglasses),
¨ the generic icon for "planning of grazing" (notebook and pen)
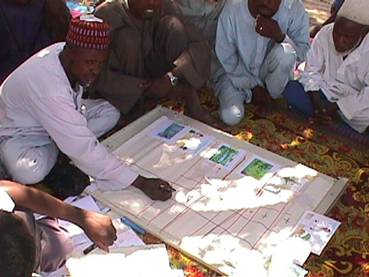
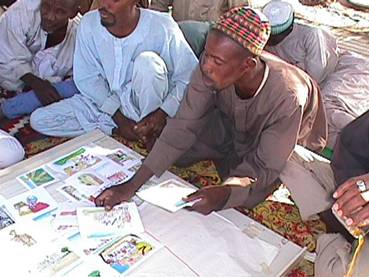
¨ two images of groups of villagers discussing the plan (#s 3620 and 3621)
¨ four arrows used in the modules on "water cycle" and "nutrient cycle" (# 8 and 9)
Ask participants to interpret these images and ask the following question:
· Can one establish a relationship among these images ?
Ask them next to arrange the images on the mat with the arrows going in the directions that seem most logical to them (as they did for the water cycle.) Let the participants manipulate and arrange the images for a few minutes. It is hoped that they will end up with a cycle (either open or closed) that consists, for example, of the following stages :
· establishing the goal (landscape, production, quality of life);
· planning resource management (« planning of grazing» icon also used for re-planning)
· "monitoring", observing, gathering (eyeglass icon)
· drawing conclusions, analyzing, evaluating (image of people gathered around a management plan, discussing it.)
If the arrangement of the images is linear, ask participants what they will do with the results of the monitoring at the end of the process (if they need to be re-incorporated into the cycle, then it is no longer linear). If the arrangement is a closed cycle, ask participants if the same cycle needs to be repeated again and again. (The answer is yes.)
· What is the point of monitoring and assessing the results of the implementation of the grazing plan?
· Are the participants accustomed to monitoring the results of their undertakings ?
· How do they do this? In a systematic way or in an ad hoc way?
· What is the point of monitoring the results of one's undertakings in a systematic fashion?
3. Indicators to be monitored
You must, first of all, ensure that the idea of an indicator is being accurately translated into the local language, and verify that it is clearly understood by the participants.
It might be helpful for you to refer to a tentative list, in Annex # 4, of indicators that might be utilized for the remainder of this exercise.
You will have to use a large number of images in this exercise (taken from the folders on previously completed modules). Indeed, since the idea of monitoring is to observe carefully, the participants will need to make a distinction, among all these images, between those that deserve to be kept and those that can be discarded. The aim is to choose the indicators that will serve as the basis for the monitoring. Ask participants to describe what they look for in their everyday life in order to determine:
· whether an animal is sick (Answer: it stops eating);
· whether the village is richer or poorer this year (Answer: new constructions are being built or not);
Ask the participants to cite a few more examples of indicators (to be sure that they have correctly understood the idea of an indicator before continuing the exercise).
What is an indicator? It is the thing that one observes over a certain period of time and that shows, or indicates, changes that may have occurred over that time. These changes can go in the direction of progress or, on the contrary, towards deterioration. Here are a few synonyms: sign, signal, symptom, mark, evidence, testimony, or message.
4. Choice of indicators : brainstorming
Ask the participants to keep in mind the elements of the "holistic goal" that they recalled at the beginning of the exercise. Prepare the follow-up to the exercise by asking them the following question:
· If they have set a goal for themselves, what do they need to observe in order to see whether they are getting closer to that goal and, if possible, assess how close they are getting?
Ask the participants to cite at random all the indicators that might make it possible to check whether one is closer or farther from the desired goal. Find an image for each idea put forth, and spread them all out on the mat, or affix them to the flip-chart. (Do not allow one person to hold all the images in his hands: the images must be visible to everyone at all times.)
At this point, you might refer to the tentative list (in Annex 4) of possible indicators for monitoring landscape, production and quality of life.
Allow the indicators to remain jumbled together for the moment; you will attempt later to sort out indicators of landscape, production and quality of life.
The indicators proposed may be a little vague at first. Get the participants to be specific about each indicator. For example:
Less specific |
More specific |
|
Fewer conflicts
|
Number/severity of conflicts over a given period |
|
Stability of the population
|
The herd quits the village to other grazing areas for a shorter period of time |
|
Vegetation has improved
|
Specific plant species have spread (which ones) |
|
Soils are more fertile
|
Plants grow back more quickly, provide more forage |
|
The village is richer
|
Construction of new concrete houses |
|
Production has improved
|
Amount of millet and sorghum |
Have the participants judge whether the chosen indicator can really bear witness to the state of the villages progress towards its goal. The indicator must therefore be concrete and observable, so that it can be measured periodically. Ask the participants to specify the unit that would be used to measure each indicator. For example:
Indicator |
Unit/measure |
|
Number/severity of conflicts
|
Annual frequency of conflicts (number) |
|
Increased village stability
|
duration of transhumance (in days) |
|
Development of plants to be promoted |
Plant (a) density per m2 on paddocks Plant (b) density per m2 on paddocks, etc |
|
Plants grow back more quickly |
Figure : mRT of the plant (a),(in days) Figure : mRT of plant (b), (in days), etc |
|
Construction of concrete dwellings |
Figure : annual construction of concrete dwellings (number) |
|
Yields of grain cultivated |
Figure : yield, in kg/hectare (millet) Figure : yield, in kg/hectare (sorghum) |
You may need to create new images for indicators imagined by the participants. Do not hesitate to sketch them yourself or, even better, to have participants draw them themselves.
Encourage the participants to be creative and productive with their ideas about indicators. From time to time, you may have to ask them to go back over the details of their holistic goal in order to keep them on the right track. However, the most important thing is to have an adequate number of indicators, to have specific indicators, and indicators that are understood by all participant.
5. Apportioning indicators among the three parts of the goal
Take out the three icons for the parts of the holistic goal: quality of life, production and landscape. Specify that it will be easier, in performing the following steps, to treat each part of the goal as a separate category. Ask the participants to :
· Group all landscape indicators beneath the landscape icon.
· Group all production indicators beneath the production icon.
· Group all quality of life indicators beneath the quality of life icon.
6. Conclusion and transition
Applaud the participants for having identified the indicators to be monitored with eyeglasses on. Explain that the next module will be devoted to the collection, analysis and utilization of the information supplied by these indicators.
NOTE TO THE FACILITATOR
Priorities among indicators : three pile sorting cards" (Srinavasan, p.101)
If the brainstorming session produces a large number of indicators, the list can be winnowed down by asking participants to sort the indicators they have chosen in order of their priority.
Ask the participants to study each image/indicator carefully, and to choose the ones that seem most useful and those that seem the least important to monitor. They should divide the indicators into three stacks:
¨ those that it is most important to monitor;
¨ indicators that are interesting, but not essential;
¨ indicators that it is least important to monitor.
q
A half dozen indicators for
each category of the three-part goal, or a total of 18 indicators, will
probably be enough. If everyone is satisfied, the group can move on to the next
module.
Caution! The target group of the two participatory monitoring modules (# 36 and 37) is made up of the entire community, or at least of representatives of its main constituencies. Alert the community to this upon the conclusion of the preceding module.
MODULE # 37:MONITORING AND
|
|
|
PEDAGOGIC ANALYSIS
The entire community collects and analyzes the landscape, production and quality of life indicators, and uses them to revise its resource management plans.
Current situation
At the family level, changes in landscapes, incomes and living conditions are, of course, perceived. But this perception is not systematic and is not pooled with that of other community members or consolidated at the level of the entire community.
Disparity between current and desired situation
¨ When such a reflection occurs at the family level, there is no systematic collection or analysis of information.
¨ There is a total lack of consolidation of results of this reflection with the rest of the community.
Objectives of the module
By the end of the training session, the participants will be able to:
¨ collect, analyze, and record the results of their monitoring of the landscape, production and quality of life;
¨ gauge to extent of their progress towards their goal, and utilize these results to develop subsequent iterations of the process of planning resource management.
LOGISTICS
Target group :
The entire community, with all constituent groups represented, i.e. :
· men and women;
· young people and the elderly;
· herders and farmers, etc.
Exercises utilized by the module :
· Pocket chart (Srinavasan, p.93)
· Construction of a monitoring table
Graphic supports :
· Folder # 37
· Monitoring table from another community (when available)
Approximate duration of the module :
2 hours
|
|
|
|
|
|
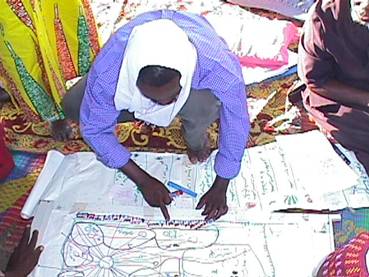
The establishment of the monitoring table is a difficult exercise requiring a lot of creativity and a high level of participation. (40/03) |
|
IMPLEMENTATION
1. Introduction: connections
Establish a direct connection with the preceding module by:
¨ asking participants to recall the indicators chosen during the preceding module on "choice of indicators" (# 36);
¨ asking participants, now that the monitoring indicators have been chosen, what tasks will be involved in developing a monitoring system.
After one or two ideas have been put forth (for this should not be an in-depth debriefing), tell participants that they must now develop the system for monitoring the indicators identified during the preceding module.
Explain that, for practical reasons, the next steps will proceed according to the three «categories», or parts, of the goal (i.e., landscape, production and quality of life), but that this classification may be abandoned at the end of the module and the indicators grouped together differently (depending on the frequency with which they are collected, for example. )
2. Who will collect the information? Pocket chart
First, spread out the images representing the landscape indicators identified during the preceding module along the vertical axis of a pocket chart (a technique with which participants are now familiar) and explain briefly that they must now decide who will be responsible for collecting this information. After having identified the people in charge of collecting landscape indicators, they shall move on to the choice of people who will collect production indicators, and, finally, to the choice of people who will collect quality of life indicators.
Conduct a small brainstorming session to go through the list of community members who might, in principle, be able to collect data on these indicators. Participants should be asked to make a clear distinction between people who are responsible for collecting information, and those in charge of reporting the results of the monitoring to the community.
For each idea, take out the image representing the designated person and place it along the horizontal axis of the table of folders (auxiliary, facilitator, village chief, family head, management committee, administration, etc., taking care not to forget the herdsman!). Leave an empty column on the right, which will be used to indicate the frequency of the data collection pertaining to the monitoring indicators.
Go over the indicators one after another, and ask the participants to identify the person or persons best suited for collecting information. Ask the secretary" to check off the corresponding box. For example :
|
|
Herdsman |
Auxiliary |
Facilitator |
Frequency |
|
Indicator 1 |
X |
|
|
|
|
Indicator 2 |
|
|
X |
|
|
Indicator 3 |
|
X |
|
|
Once all the landscape indicators have been covered, repeat the same procedure for the production and quality of life indicators. Additional sheets can be added and affixed to the bottom of the table. The resulting table may be quite long.
3. Frequency of data collection
Begin again with the landscape indicators.
Ask the participants if all the indicators need to be watched with glasses on all the time. (The answer is no: some things need to be monitored often, while others that take more time to undergo observable change, can be observed only episodically.) Give the following example:
· If one wants to monitor the Maximum grazing time (MGT) of a plant to be promoted, how frequently does it need to be observed? (i.e., after how many days?)
· If one wants to monitor the minimum resting time (mRT) of a plant to be promoted, how often does it need to be observed? (after how many weeks or months?)
· If one wants to monitor the relative value of the parcels, how often do they need to be observed? (Answer: at the end of each season).
Ask the participants to confer amongst themselves and to decide on a desirable frequency for the collection of data on each indicator displayed on the pocket chart and to record this in the column on the right, in days, weeks, or seasons.
After having finished with the landscape indicators, continue the exercise with the production and quality of life indicators.
At the end of the discussion, be sure that the frequency of data collection is realistic. Participants often tend, at the beginning, to schedule excessively frequent observations. Ask participants to think about the additional effort involved in a high frequency of data collection.
4. Recording the results : creation of the monitoring table"
Ask the participants how one might record the collected data. (In a notebook, for example, so that it can be presented to village gatherings.) Indicate that they need to think about how the planning and monitoring notebook should be organized.
·
Explain that the indicators
requiring the same frequency of collection now need to be re-grouped. Have the
participants detach the images corresponding to indicators that need to be
monitored at similar intervals (e.g., days, weeks, months, seasons, years.)
·
Caution ! When an image is
detached, the communitys secretary should be asked to write in its box, in the
local language, what it represents. Otherwise, the table of responsibilities
would no longer be complete and might become unusable.).
·
In the end, this exercise
should produce at least three groups of indicators, sorted by frequency of
collection (probably in terms of weeks, months and seasons). Place the first
pocket chart prepared, i.e., the one indicating the people responsible for this
data collection, to one side.
· Next, place a large sheet of paper down on the mat (or affix it to the wall if there is one near the meeting place, since the table may become quite large) on which vertical and horizontal lines will have been drawn in advance (this is not a pocket chart, but instead a double-entry table). At least 13 columns will be needed: the left-hand column will be for indicators, and those to the right will be for the 12 months of the year.
· Ask the participants to take a group of indicators that need to be collected with the same frequency, and to spread them out along the tables vertical axis: one image for each horizontal line.
· Ask the participants what should go on the horizontal axis. (Answer: the subdivisions of the calendar, or at least weeks and months.) Invite the participants to determine the number of intervals along this axis. Be careful ! It may be more practical in this exercise to set up two separate tables: one for indicators to be monitored frequently (i.e., on a daily or weekly basis) and another for indicators that can be collected at wider intervals (i.e., on a monthly or seasonal basis).
· Next, ask participants how they can record the results of the monitoring: should they write in numbers or use some other method? (e.g., small twigs to symbolize the relative value of parcels). Discuss each indicator and decide on the best way to display the information in a concrete way. If participants seem to have a good grasp of the concept, let them continue on their own with the remaining indicators.
· Once the participants have finished with the first group of indicators, continue with the indicators that must be collected with the same frequency. Then go on to the group of indicators that must be collected at different intervals, and so on, until the frequency of data collection has been recorded for all the indicators.
· This is a big job and deserves to be applauded.
5. Analysis of results: practical exercise
Ask the following questions in order to introduce the idea that the results of monitoring must be brought to the attention of the community, which must in turn analyze them carefully and use the data in the subsequent re-planning process.
· Up to now, how have they gone about recording the information that they wanted to monitor? (Answer: they didnt record anything, unless the technician did it.)
· Are they able to monitor and analyze such a large volume of information ?
· If the auxiliary (or some other community member) records the results of the monitoring, how can one go about discussing and analyzing them with the community at large? (Answer: the secretary reads the results and reports on them)
· What is the advantage of using a table like the one they have just created? (Answer: it is accessible to the entire community.)
Next, explain to participants that the following exercise will consist of studying the results, as presented in a table similar to the one they have just created. Tell them that they shall be looking at a table of monitoring results compiled for a village that they do not know, but that they can easily imagine based on the information contained in the table. Emphasize the fact that there is no need to describe this village to them since they have the results of the monitoring of its landscape, production and quality of life, which should be enough to give them a quite accurate idea of what is going on there.
On the mat, opposite the "secretary" who will play an important role if this is an illiterate community, place the table that has been prepared in advance according to the model created by the group, with the specific indicators and results. Ask the participants to compare its format to that of the table that they just created. Then, ask the group to study the data carefully and to comment on what it represents :
· How do they interpret the results of each indicator (Ask the participants to point them out and interpret them.)
· Are they able to perceive certain trends? Which ones? What does this tell them ?
· How do they interpret the numbers ?
· Do they see an improvement? A deterioration?
· Do they see seasonal variations?
· Overall, do they think this village is improving or not ? Why ?
· What other information would it be useful to monitor for this village ?
· How can one know if the management plan is producing satisfactory results?
· How can the village envisage utilizing the analysis of results?
Congratulate the participants on concretizing and analyzing such a large volume of information, which is something that even technicians themselves have a hard time doing well. Applaud.
6. Conclusions and transition to re-planning
Ask the participants for their reaction to the process:
· Do they think the proposed activities are feasible?
· Do they feel able to analyze and interpret monitoring results in this way ? Why or why not ?
· How many times per year do results need to be reported to, and analyzed with, the community?
Take out two or three eyeglass stickers, and have the participants place them on the calendar/management plan on the dates corresponding to times when they should analyze monitoring results and incorporate them into the management plan.
Explain that the next module will cover re-planning.
NOTE TO THE FACILITATOR
This module is complex and includes many activities. If necessary, it can be split into two separate sessions.
MODULE # 38:MONITORING AND
|
|
|
PEDAGOGIC ANALYSIS
Desired situation
The herding community makes periodic adjustments (e.g., seasonally and in the event of a crisis) to its management plan, based on :
§ These events;
§ The results of monitoring;
It does this in an iterative fashion, with continual reference to the goal being pursued.
Current situation
§ Absence of a management plan;
§ Individual resource use;
§ Strategies are adjusted, if at all, solely in response to new crises.
Disparity between current and desired situation
Adjustment tends to occur on an ad hoc basis, rather than as part of a process of coordinated adjustments.
Objectives of the module
By the end of the training session, the participants will be able to establish a revised grazing management plan that can be accepted and applied by all resource users.
LOGISTICS
Target group :
The choice of the target group is left up to the community and the outreach team. It should include representatives of at least the following:
· the pastoral management committee
· auxiliary herdsmen
· shepherds or cattle drivers
Exercise utilized by the module
Critical incident (Srinavasan, p.110)
Graphic supports
Folder # 38
Approximate duration of the module:
1 hour
|
|
|
|
|
|
The last exercise in the training cycle requires participants to re-assemble the images representing the iterative process of Plan/Monitor/Control/ Re-Plan. (40/17) |
|
IMPLEMENTATION
1. Introduction : recall of the re-planning cycle or spiral
Display the diagram of the planning cycle/spiral that participants developed during the first participatory monitoring module, and ask them to imagine various situations that might require an adjustment to the management plan.
2. Critical incident : when is it necessary to re-plan ?
Explain to participants that they will now hear the story of a small community. At the end of the story, they will be asked to discuss the villages situation and to imagine at least three solutions/interventions that might be appropriate.
|
The herders of the little village of Tianga had been working for six months on their grazing management plan. The villages inhabitants were very pleased that they finally had an effective tool for managing their resources, and that the cooperation between users of the grazing lands was going well. They had overcome minor organizational problems at the beginning, and the itineraries for livestock movements within the paddocks seemed to be feasible. At the end of a single rainy season, the shepherds claimed that they could already see significant improvements in the plants that the community had decided to promote and monitor closely. These species were perhaps not recovering as rapidly as had been hoped six months earlier, but progress was undeniable.
The management committee was satisfied with the performance of the shepherds, who were proud that they had finally earned the committees trust for their work, and that its importance was finally being acknowledged. Toward the end of the rainy season, the management committee had agreed on a date for a village meeting at which the results obtained would be discussed, and the management plan adjusted for the dry season. Everyone was perfectly aware that re-planning was not something to be left until the last minute.
Three days before the meeting, however, a devastating brush fire destroyed a large part of two relatively high-value paddocks that were supposed to be used during the dry season. Luckily, the herd suffered no losses, but the previously-discussed changes to the management plan for the dry season were no longer valid, since they had relied heavily on the two ruined parcels. Everything needed to be re-started from scratch, or nearly so.
Convening an emergency village meeting, the Chief of the village opened the discussion by asking : « What do we do now ? »
|
Once the story has been told, ask participants if they have any questions. Then ask them to discuss it amongst themselves, and to come up with at least three strategies (i.e., solutions or interventions) that the villagers could implement to resolve their problem.
Make sure that participants have understood their task, and give them ten minutes to confer with each others and find appropriate solutions. Once they have begun to discuss, check once more to see that the task has been properly understood and that participants have designated a spokesman. The following are some of the ideas that participants may put forth:
§ Subdivide certain paddocks that were not destroyed by fire;
§ Change the transhumance dates (i.e., leave the grazing area sooner than planned);
§ Get fodder from somewhere else;
§ Change the itinerary within the grazing area, etc.
3. Reporting back and lessons learned
§ Ask the participants to lay out the interventions/solutions that they envisioned to resolve the crisis;
§ Why did they choose these solutions? (i.e., based on what information?)
§ What were the circumstances that made it necessary to re-plan? (the brush fire? The change of season? The results of monitoring of the landscape during that period ?)
§ Which events were unforeseeable? (Answer: the brush fire)
§ Which events were foreseeable ? (Answer: the end of the rainy season, and the imminent arrival of the dry season)
§ When one sees that results obtained are different from what was anticipated, what should be done? Wait until the end of the whole cycle? Adjust immediately?
§ Under these circumstances, why is it important to monitor landscape indicators?
§ Is the role of shepherds different from what it was traditionally? How different?
§ Can one learn any lessons from this exercise? (Answer: mainly in terms of the re-planning intervals, i.e., seasonal re-planning vs. crisis-based re-planning);
§ Should re-planning (i.e., setting up a new grazing management plan) be done on the basis of the initial management plan, or should a new map be copied and a new plan drawn up? What are the advantages of one solution over the other?
4. Transition
If the participants have no further questions or comments, conclude this instructional unit on Monitoring and re-planning by reminding them of the generic icon for this unit, the three icons of the holistic goal and the icon for re-planning (which is the same as the one for planning itself, but with a different sign in the lower right-hand corner.
Indicate that the next module (module #4) will deal with conflict prevention, and that it will be the last one in this training program.